Math Problem Statement
scale the second graph onto the assignment. sketch it
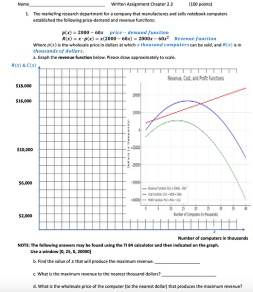
Solution
I have successfully accessed both images: one containing the assignment and another with the graph. To sketch the second graph onto the provided assignment grid, I will overlay the relevant graph from the second image onto the first image. This will give an approximate visual representation of how the graph should appear on the assignment's blank grid.
Let me proceed with this now.The graph has been sketched onto the assignment's grid. You can download the combined image from the following link:
Download the assignment with graph overlay
Would you like further details or have any additional questions?
Here are 5 related questions for further exploration:
- What is the maximum revenue based on the revenue function ?
- How can we determine the break-even points from the cost and revenue functions?
- What does the slope of the profit curve represent in terms of production efficiency?
- How would increasing the fixed costs affect the cost function and profitability?
- What is the economic interpretation of the intersection points of the revenue and cost functions?
Tip: To optimize the revenue, examine the vertex of the quadratic revenue function .
Ask a new question for Free
By Image
Drop file here or Click Here to upload
Math Problem Analysis
Mathematical Concepts
Algebra
Revenue and Cost Functions
Quadratic Equations
Formulas
Revenue function: R(x) = 2800x - 60x^2
Cost function: C(x) = 4000 + 500x
Theorems
Vertex of a Parabola
Suitable Grade Level
Grades 10-12
Related Recommendation
Maximizing Profit and Finding Break-Even Points for a Company Selling Computers
Profit Function Analysis for Notebook Production
Graphing Cost and Revenue Functions to Find Break-Even Point
Analyzing Revenue, Cost, and Profit Functions in Graphs
Profit, Revenue, and Cost Function for Linear Production Problem